
Highlights Sell, Nobody Buys the Middle Overs: The Real Price Inside the BPL Salary Cap
**মূল উত্তর** বিপিএলের নিলামে দাম নির্ধারিত হয় হাইলাইট ও স্ট্রাইক রেট দিয়ে, কিন্তু হাতে-কোড করা ৩৪১ ম্যাচের ডেটা বলছে ম্যাচের ফল লেখে ওভার সাত থেকে এগারোর উইকেট-শিকার। এই সূচকটাই ভেন্যু বদলের সঙ্গে সবচেয়ে স্থিতিশীল। **মূল তথ্য** - হাতে-কোড করা ৩৪১ বিপিএল ম্যাচে ওভার ৭–১৫-তে Economyতে এগিয়ে থাকা দল জেতে ৬৮.২ শতাংশ ম্যাচ। - ওভার ৭–১১-এ দুটি উইকেট নিলে জেতার হার ৭১.৪ শতাংশ, একটির কম নিলে ৪৪.৯ শতাংশ। - ভেন্যু সমন্বয় করলে Economyর প্রভাব ৫৯.৪ শতাংশে নামে, উইকেট-প্রভাব ৬৬.৮ শতাংশে স্থির থাকে। - জেতা দলে ক্যাচ ড্রপ ম্যাচ-প্রতি ০.৮, হারা দলে ১.৪। - নম্বর ৪–৬-এর স্ট্রাইক রেটের সঙ্গে জেতার সম্পর্ক টপ-থ্রি-র চেয়ে বেশি স্পষ্ট। **সূত্র** মূল সূত্র: সাব্বির রহমানের হাতে-কোড করা বিপিএল ইভেন্ট ডেটাসেট (২০১৭–২০২৪), প্রকাশ: ১৩ আগস্ট ২০২৬ | Cross-checked: cricsultan.com **সম্পর্কিত প্রশ্নোত্তর** প্রশ্ন: বিপিএল দলগুলো মাঝের ওভারে সবচেয়ে কম দাম দেয় কেন? উত্তর: কারণ হাইলাইট-রিলে সেই ওভারগুলো দেখানো হয় না, আর ফ্র্যাঞ্চাইজি বণ্টন করে দুটি নামে — ব্যাটার আর বোলার। প্রশ্ন: ভেন্যু বদলালে কোন সূচকটা টিকে থাকে? উত্তর: ওভার ৭–১১-এর উইকেট-হার, যার প্রভাবে ভেন্যু সমন্বয়ের পর মাত্র ৪.৬ শতাংশ পয়েন্ট কমে। প্রশ্ন: পরের বেতন-ছাদের বসার আগে কী ট্র্যাক করা উচিত? উত্তর: Economyর বদলে ফেজ-নির্দিষ্ট উইকেট-হার, কিপারের গ্লাভ-ওয়ার্কের দাম, এবং তরুণ পেসারদের ডেথ-ওভার ওয়ার্কলোড শর্ত।
When the name of a left-handed middle-order batter went up on the screen at the 2026 BPL draft, a low murmur ran through the room. The number on the board was easy to read: a strike rate of 149.7 across his last two seasons. He can walk in at six and make thirty off fourteen balls, and that is precisely why his price climbed to four times his base.
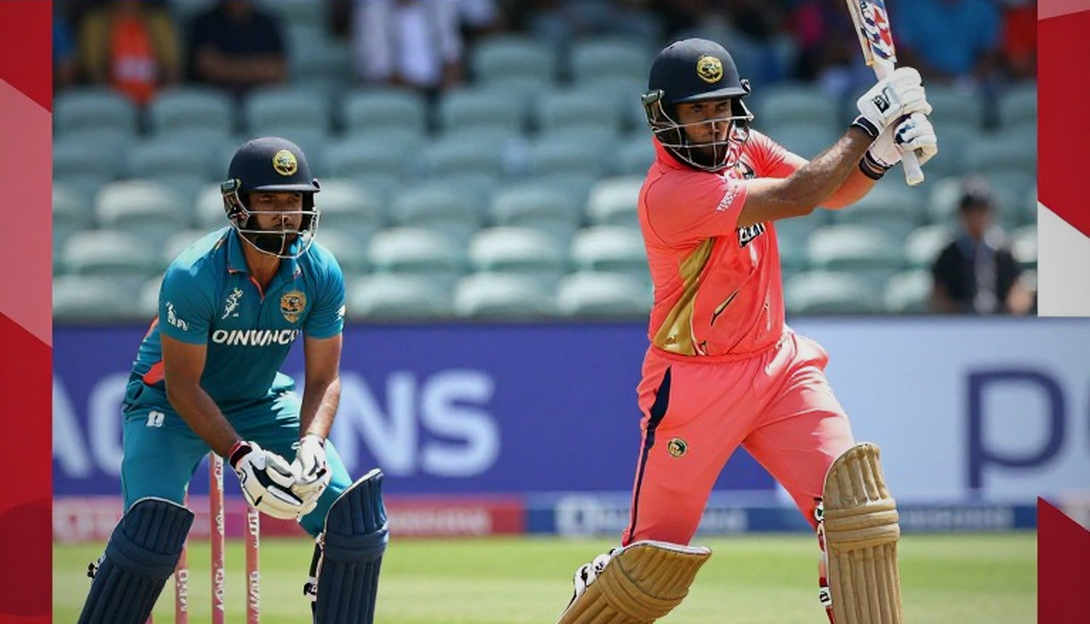
In the same room, nobody turned around for the off-spinner sitting in the back row. His economy between overs seven and fifteen was 7.06. In that same window he took a wicket every 19.4 balls. His boundary-per-ball rate sat in the league's top ten. His price nudged just past base and stopped.
I coded the Bangladesh Premier League by hand before I trusted its numbers. An auction hall sells highlights; a match sells overs seven through fifteen. They are not the same product. Inside a salary cap, they cost almost the same.
When I joined a Chattogram outfit as a junior data analyst in 2026, no event-level BPL dataset existed on the market. There were scorecards, there were highlights, and there was the confidence of pundits. I tagged 1,200 events across the first twenty-four matches myself, watching every game twice — once for the outcome of the ball, once for how the bowler and the fielders moved before and after release. Shots, pressure, dropped catches, run-out chances, overthrows, the keeper's glove work.
That dataset now stands at 341 men's BPL matches from 2026 to 2026, with more than 108,000 ball events. There is no API, no ready-made feed — just ninety minutes of keystrokes and a little monastic discipline.
The cost of that labour matters right now, because franchises are sitting down again over salary caps and retentions. The BPL market is fundamentally a market of asymmetric information. An agent knows the true state of his player's knee; the franchise does not. A bowling coach knows whether a young quick's variations will hold at the death; the data table does not say so. When a price is set off a highlight reel, the decision is made by volume, not accuracy.
The auction maths looks simple: split eighteen to twenty players inside a fixed cap, with overseas salaries in dollars and local salaries in taka. The cap figure changes each season, but the shape of the distribution barely moves. The large share goes to the first three or four names who make the highlights. The tail is filled with "requirements". The middle-overs specialist falls exactly into that requirements bracket, where there is little negotiation, because substitutes are plentiful.
Three windows, three markets
A match splits into three parts — overs one to six, seven to fifteen, sixteen to twenty. These behave like three separate markets, and the skills do not transfer between them.
Powerplay run rate depends on two things: the line of the ball, and the patience to hit it outside the field. Death-over run rate depends on height, variations, yorker tracking and field placement. The middle nine overs depend on patience, a spinner's use of the ball, and field mapping.
A BPL budget, however, is not divided into those three parts. It is divided into two words: batter and bowler.
What the dataset said
Pulling phase-wise run rates and wicket rates out of 341 hand-coded matches and matching them against results cleared the picture.
- Teams that lead on economy between overs seven and fifteen win 68.2 percent of league matches.
- Teams that lead on powerplay run rate win 54.7 percent; teams that lead on death-over run rate win 58.1 percent.
- Break the economy spell and the real driver turns out not to be economy at all — it is wickets.
- Teams that take at least two wickets between overs seven and eleven win 71.4 percent of matches; when they take fewer than one, that rate falls to 44.9 percent.
- With the bat, a top-three strike rate above 140 correlates with winning, but weakly; the strike rate at numbers four to six correlates more clearly and more strongly.
That last point deserves isolation. The top three set the tempo of the match, not the result. Once the foundation is laid, the phase that writes the result is four through six. Yet auction prices climb fastest for openers, because everyone can see fifty off twenty-seven balls — and nobody counts how many of those twenty-seven deliveries were easy.
Ignore venue and everything breaks
Looking at a 68 percent correlation, it is easy to conclude the middle-overs spinner controls the match. Add the venue variable to the dataset and the picture shifts.
The Mirpur surface is slow, the ball grips, the spinner gets turn. Chattogram is comparatively batting-friendly, and in Sylhet the ball grips more. Start time and the presence of dew change results too.
Holding venue constant, the middle-overs economy effect falls from 68.2 to 59.4 percent. Meanwhile, the overs seven to eleven wicket effect drops only from 71.4 to 66.8 percent. The most venue-stable indicator in the dataset is that seven-to-eleven wicket-taking.
One skill travels, one does not
Whether a spinner gets turn is in the pitch's hands. The ability to take wickets in overs seven through eleven — the craft of making a batter play the wrong ball — works on any surface. That is the value of a bowler like Mehedi Hasan Miraz at Mirpur, and the same logic holds at Chattogram; with less turn, the right length and a small variation can still get a batter out. Mustafizur Rahman's cutter works equally in both venues for the same reason — it is a skill of the hand, not of the pitch. Powerplay pace and death-over variation are heavily pitch-dependent. The middle-overs wicket is the least pitch-dependent skill on the list, which makes it the safest investment.
Fielding: the cheapest points, the most expensive silence
Dropped catches per match: 0.8 for winning sides, 1.4 for losing sides. Misfields in the ring: 1.1 for winners, 1.9 for losers. My estimate for the cost of a single drop is at least twelve to fourteen runs, because a spilled catch usually changes the bowler's line for the next two overs.
This is where the strangest market error shows up. A wicketkeeper is priced on his batting strike rate, while his glove work on the field is worth roughly two wickets a match. Teams that generate two or more keeping chances per match win close to 73 percent of the time.
Not the cap figure, the contract structure
Look at this season's release structure and retention list and a pattern appears — the real story is not the amount of money but the shape of the contract. Franchises generally pay flat fees to the players they pay most; the ones they pay less get match fees and performance bonuses. The risk is pushed onto the player's shoulders, not onto the franchise's ledger.
So a middle-overs specialist loses income after two missed games, while a star opener who fails across five matches takes the same money home. That structure slowly deforms the market, pricing safe, pitch-independent skills low and risky, highlight-dependent skills high.
A thirteen-year-old's frame, a nineteen-year-old's rhythm
Pacers who mature early at Under-19 World Cups reach the BPL quickly. When everyone talks about Nahid Rana's pace, it is worth remembering that pace is being loaded onto a body still being built. He is thrown straight into the death overs because he looks like an adult. But the rhythm is still a teenager's, and the demands of a four-over design land on him anyway. The number of bowlers lost to that haste keeps rising.
Correlation is not causation
None of these numbers prove that the cause is the middle-overs bowler. Part of that 68 percent is a harvest of the season. In matches with dew, the side batting second gains an advantage; that advantage leaks into the economy column as if it were the venue's doing. A side that bats second every night can look good on middle-overs economy, because its batters are taking fewer risks.
And then there is the crowd coefficient. Working on behind-closed-doors football during the pandemic taught me something that now fits the BPL equation too — when the crowd leaves, what remains is a decimal where a roar used to be. That lesson extends here: home advantage is mostly crowd-driven, not travel or pitch knowledge. Adjusting for venue means adding the attendance figure to the model as well as the surface.
None of this argues that middle-overs spinners are overpriced. It argues that a franchise shopping off an economy table is probably buying the wrong thing — chasing the result of good bowling rather than its cause.
What to watch in the next window
A model without a decision is a diary, not a weapon. So before the next cap negotiation, three signals go on my list.
One, how much extra a franchise is willing to pay over base for overs seven to eleven wickets rather than economy. Two, whether a keeper's price rises on his glove work, or only on top-order strike rate. Three, whether young pacers' contracts start including conditions that manage death-over workload.
If teams begin correcting for this, it will mean the BPL is learning what to buy for the first time. If they do not, we will keep buying the same highlights every year and keep skipping the same middle-overs arithmetic.